Blair ORACLE is an election model created by the Magnet class of 2023 at Montgomery Blair High School. The model uses current polling data and past election results to try and predict the outcome of the 2022 Senate elections.
Blair ORACLE, and its Senate Election Forecast, is admittedly not one-of-a-kind. The ORACLE has many contemporaries in the election-modeling sphere, but no two models are alike. While it may seem counterintuitive to consult the competition, at Blair ORACLE we like to know our enemy. During the development and subsequent testing of our model we frequently consulted other election models and their results. During this research, we noticed a couple things: our acronyms are way better and, while we were getting similar outcomes, our confidence in our results was much lower. For example, in the Wisconsin Senate race on 10/21/22, the ORACLE, FiveThirtyEight, and the Economist's model all predicted Mandela Barnes (D) to receive within 2-points of the same vote share. However, ORACLE gave Barnes a 47% chance of victory while FiveThirtyEight and the Economist gave him a 25% and 29% chance respectively. Considering the models had similar centers, but widely differing chances of victory, we can assume that ORACLE's amount of variance in the state was much higher than the other models.
Wisconsin is not the only race where our model shows less confidence in its predictions. Below we compiled some other races where the three models predict similar vote-% (aka centers), but have much different predicted Win-%. As you can see in the table, this happens in both close battleground races and much more lopsided elections.
| Senate Race | ORACLE Dem Vote% | ORACLE Dem Win% | Economist Dem Vote% | Economist Dem Win% | 538 Dem Vote% | 538 Dem Win% |
|---|---|---|---|---|---|---|
| WI | 49.6 | 47 | 48.7 | 29 | 48 | 25 |
| AZ | 51.9 | 59 | 53.7 | 92 | 52.2 | 77 |
| FL | 47.9 | 38 | 47.9 | 19 | 45.9 | 11 |
| CO | 54.7 | 73 | 54.4 | 95 | 54 | 89 |
| MO | 43.5 | 23 | 41.6 | 1 | 40.7 | 1 |
| OK- Special | 41.4 | 16 | 39.7 | 1 | 38.8 | 1 |
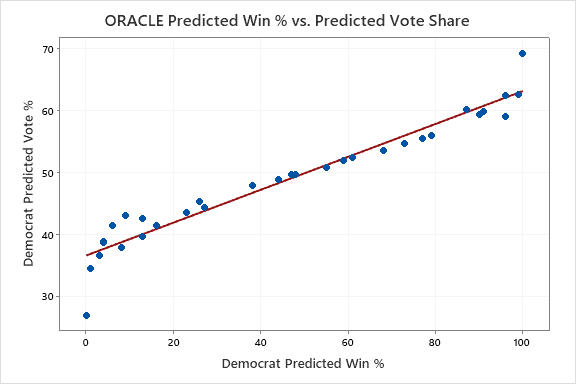
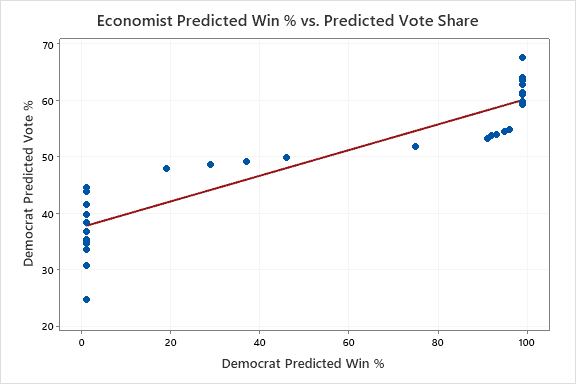
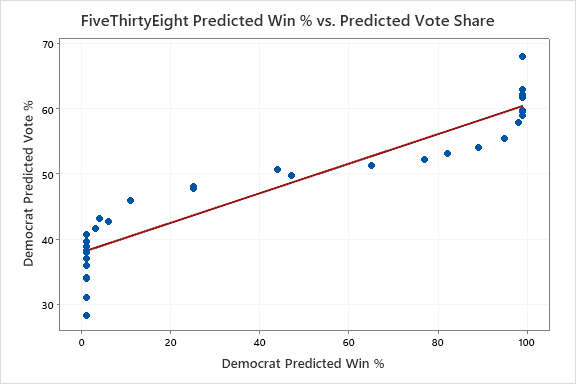
Initially, to visualize this phenomena, we created the following scatter plots for each model we analyzed (ORACLE, FiveThirtyEight, and The Economist) that compare predicted win percentages and predicted vote share in each Senate forecast.


As you can see, our model does not follow the same pattern as the two professional models. Both The Economist and 538 “flatlined” (had predicted win percentages approaching 0 or 100), once their predicted vote share in a race passed a certain threshold. For 538, their model flatlined when a race was predicted to be won/lost by around 20 percentage points. For The Economist this threshold was only about 10 percentage points. ORACLE does not experience this flatlining. But is this visual observation statistically significant? Time for a T-Test! Specifically, we used a matched-pairs T-Test to compare ORACLE’s predicted win percentage (distance from 50%) in each state, with the other two models. Lo and behold, there sure was a statistical significance!
| Models Compared | T-Value of Matched Pair T-Test | P-Value of Matched Pair T-Test |
|---|---|---|
| ORACLE vs. FiveThirtyEight | -7.10 | 0.000 |
| ORACLE vs. The Economist | -6.66 | 0.000 |
| FiveThirtyEight vs. The Economist | -0.98 | 0.337 |
This is not because we are insecure highschool students. Our model somehow added far greater amounts of variance than our competition. Since other models hide their methodology, we can only speculate about how and why we have so much variance. As seen in our methodology, we add variance for just about everything, which definitely contributes to our noncommittal predictions. For example, GOOFI (Gradient of Ordinary Fixedness Index) is a fun retronym indicating variance added due to how wrong our model has been in the past. We calculate GOOFI for each individual state, while some indicators of variance link states or are nationwide.
While FiveThirtyEight and the Economist do not publish the variance of their models, from the certainty displayed we can assume that they have less. By comparison, ORACLE uses many sources of variance that reduce the certainty of our results.
Unfortunately, professional election models do not publish their methodology, so we will never know for certain why they are so much more confident in their predictions compared to the ORACLE. Interestingly, at the time we collected data for this project (10/21/2022), all three models predicted the same winners in each Senate race. This suggests that our models had similar processes for determining centers, which includes analyzing prior elections, demographics, and polling data. Election modeling will always be conducted in a sort of “black box” where data is fed to a program and hopefully a prediction is spit out that makes some sort of sense. It is not until election day until we will know if our levels of variance were appropriate, and even then it will be hard to say. Centers are easy, simple. Variance is more of a black magic.