Background
In recent election cycles, polls have systematically overpredicted Democratic support; according to the Washington Post, the average poll overestimated the margin of support for Joe Biden above Donald Trump by almost 4 percentage points. Furthermore, according to the American Association for Public Opinion Research, the Governor and US Senate election polls fared even worse as the average Democratic candidate was overpredicted by 6%.
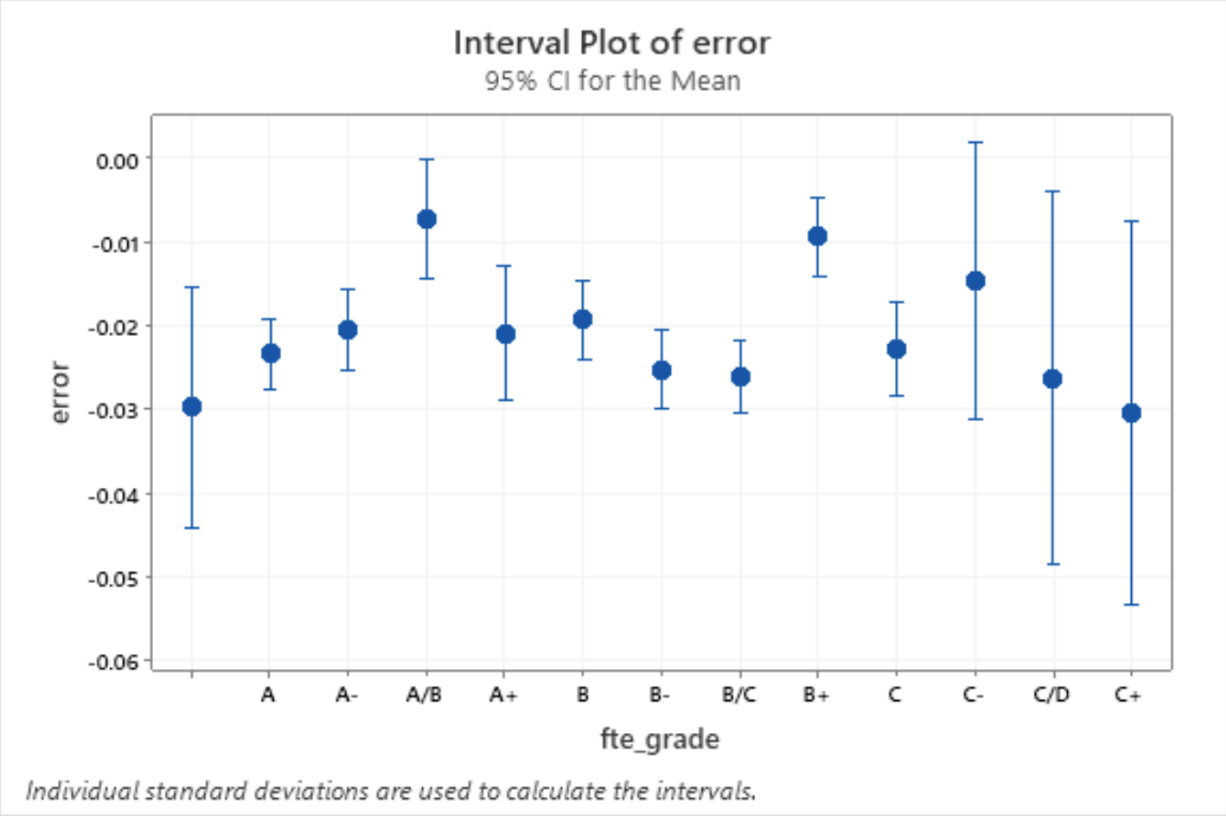
Our own preliminary analysis on US Senate polls for the 2018 and 2020 election indicated that this error was present regardless of the FiveThirtyEight grade of the poll, with even grade A and A- polls having an average of >2% error in favor of Democratic candidates (Figure 1). Therefore, past election polls regardless of grade exhibit Democratic biases, so we believe that current US Senate election polls used in Blair ORACLE will have the same partisanship.
In the Blair ORACLE, we account for historical poll error by adding additional variance (through GOOFI), but we do not adjust the center of current US Senate election polls even though there exists consistent Democratic polling partiality in the past. In this blog post, we seek to account for this bias by adjusting both current US Senate election polls and generic polls using the mean historical poll error for the 2018 and 2020 election cycles.
Methodology
Since we are targeting systemic democratic bias in both generic polls and US Senate polls, the two aspects of the current model that are going to be altered are (a.) the weighted average of 2022 US Senate election polls per state and (b.) BIGMOOD, i.e. the weighted average of 2022 generic polls. We maintained all other aspects of the current election model when running our simulations, so for important background information, please refer to the ORACLE Methodology section.
Adjusting State Senate Polling Error
We compiled all US Senate election polls with a FiveThirtyEight grade better than D before separating the polls by state. We excluded states that had (a.) no Senate elections in 2022 or (b.) states that had ≤5 total Senate polls. We made these exclusions because states in group A won’t influence the 2022 election, and states in group B have so few polls that the inherent sampling error would be too large.
Correct Old Poll Error (COPE)
For each poll, we calculated the Democratic Two-Party Percentage (Poll DTPP) and Actual Democratic Two-Party Percentage (Actual DTPP) with:
The correct old poll error (COPE) for that poll would be calculated using:
State Correct Old Poll Error (SCOPE)
To average all the polls in a state for a given election year (2018 or 2020), we assigned them a Poll Time Weight (PTW) based on the time till election using the following equation:
For each poll i, we calculated a Percentage Weight (PW) given a total number of polls n :
The polls were then averaged with their percentage weights to calculate the State Correct Old Polling Error (SCOPE):
If a state had Senate elections in both the 2018 and 2020, we averaged each year’s respective SCOPE to obtain a final state SCOPE:
State Electoral Error Tweaking by Historical Elections (SEETHE)
Each state’s SCOPE was added onto the Old Weighted Average of Current US Senate Polls for that state (OWACP) to calculate the New Weighted Average of Current Polls (NWACP):
Adjusting Generic Polling Error
We took all the generic polls for the 2018 and 2020 election cycles with a FiveThirtyEight grade better than D. We grouped the polls based on election season and calculated (a.) the election season’s Popular Vote Democratic Two Party Percentage (PVDTPP) and (b.) each poll’s Generic Poll Democratic Two-Party Percentage (GPDTPP):
We obtained the Generic Poll Error (GPE) of each poll which is:
Averaging Polls
To average all the generic polls for a given election year, we assigned them a Poll Time Weight (PTW) based on the time till election using the following equation:
For each poll i , we calculated a Percentage Weight (PW) given a total number of polls n:
All the poll’s GPE were averaged with their percentage weights to calculate the Cycle Generic Poll Error (CGPE):
To obtain the Total Generic Poll Error (TGPE), we averaged the CGPE's of the 2018 and 2020 election cycle with the following equation:
We then added TGPE to the original ORACLE BIGMOOD to obtain the adjusted BIGMOOD.
Limitations of Our Methodology
Our adjustments have several limitations, both in implementation and in theory. States without enough polls to be counted were treated as if they had zero error, which is definitely not true. However, this was not as significant a flaw as it may seem because states lacking in polls were usually those states that were not competitive. In addition, we only had data for the 2018 and 2020 races, which exposes our analysis to being over-reliant on a single race for determining the pattern of error in a state.
Regional and State Poll Bias Analysis for 2018 and 2020 Cycle Polls
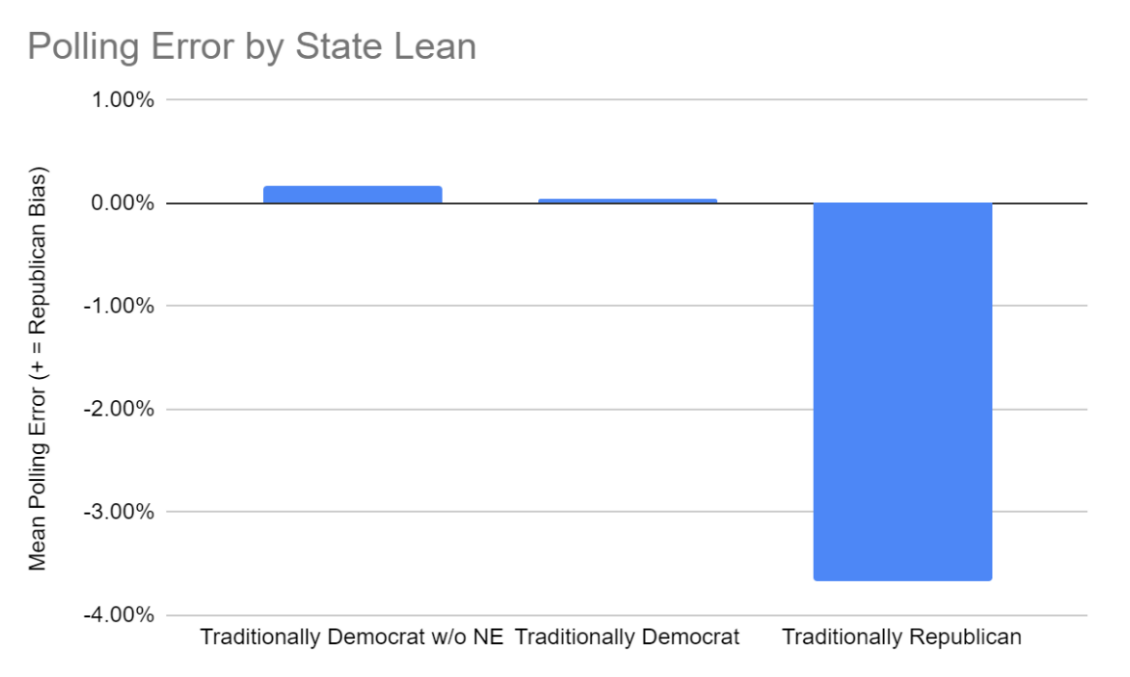
For states that historically lean towards one party, polls tend to overestimate the opposition (Figure 3). However, these errors are greatly skewed in favor of the Democratic party with traditionally Republican states having an average of more than 3.5% polling error in favor of the Democrats (Figure 2).
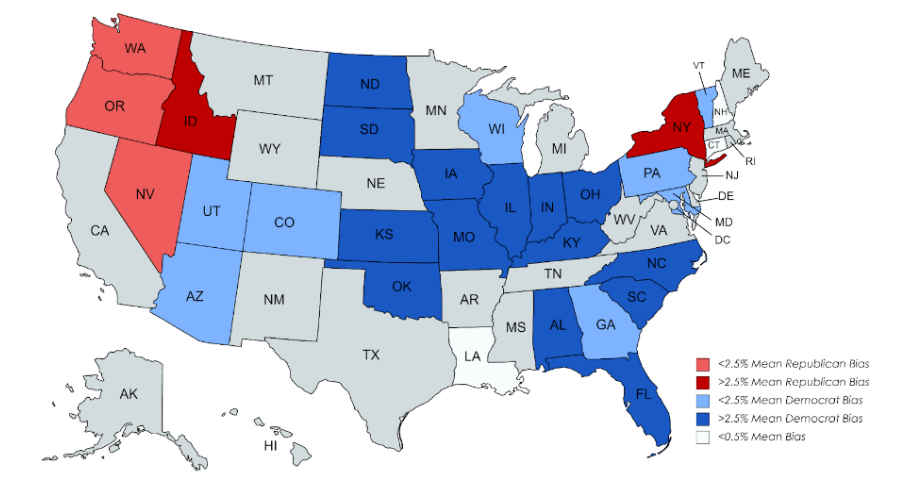
Most notably Idaho, which leans very heavily Republican, also has a weighted average of 5% pro-Republican bias. Vermont, Maryland, and Colorado are all historically Democratic, and polls slightly over predicted Democratic candidates in those states.
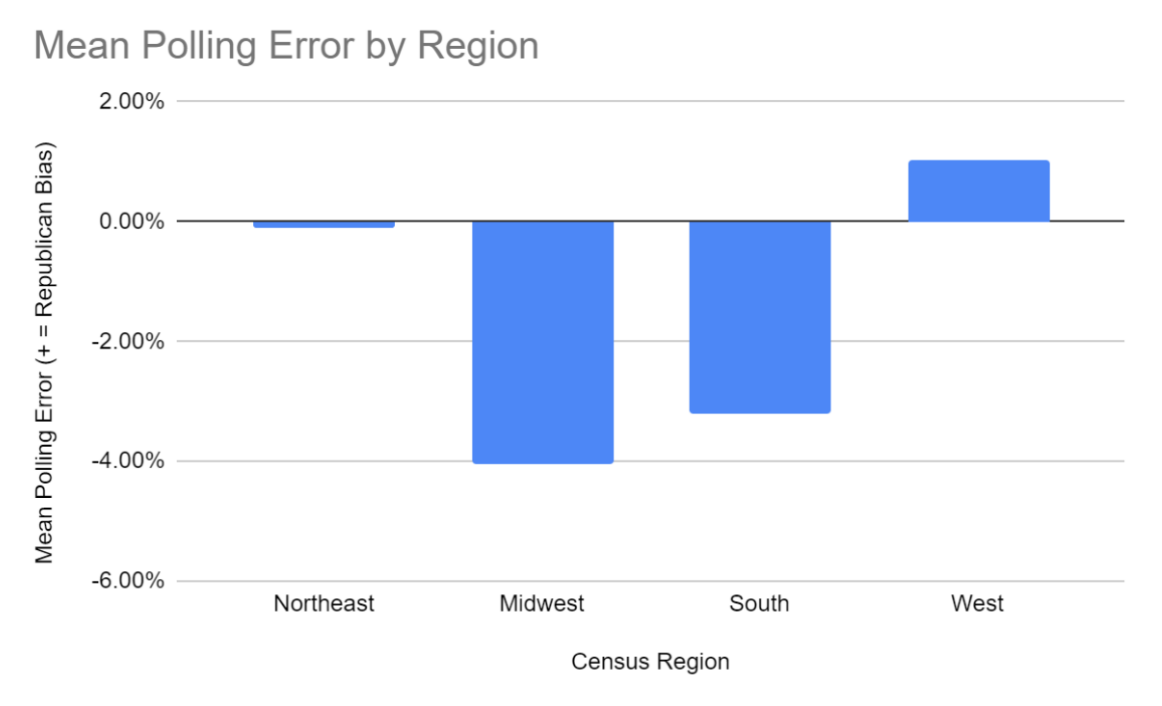
Breaking down further by census regions, polls for races in the West overpredict Republicans by an average of around 1%, and those in the South and Midwest overpredict Democrats by an average of around 3.2% and 4% respectively. Those in the Northeast by less than 0.1% in either direction (Figure 4).
It should be noted however that the Northeast contains the outlier of New York which when excluded from the average gives a new mean error of just under 1% in favor of Democrats. In summary the Midwest and South both have heavy Democrat bias in polling, while the West and Northeast tend to have a much smaller Republican bias in polling.
Simulation Outcomes
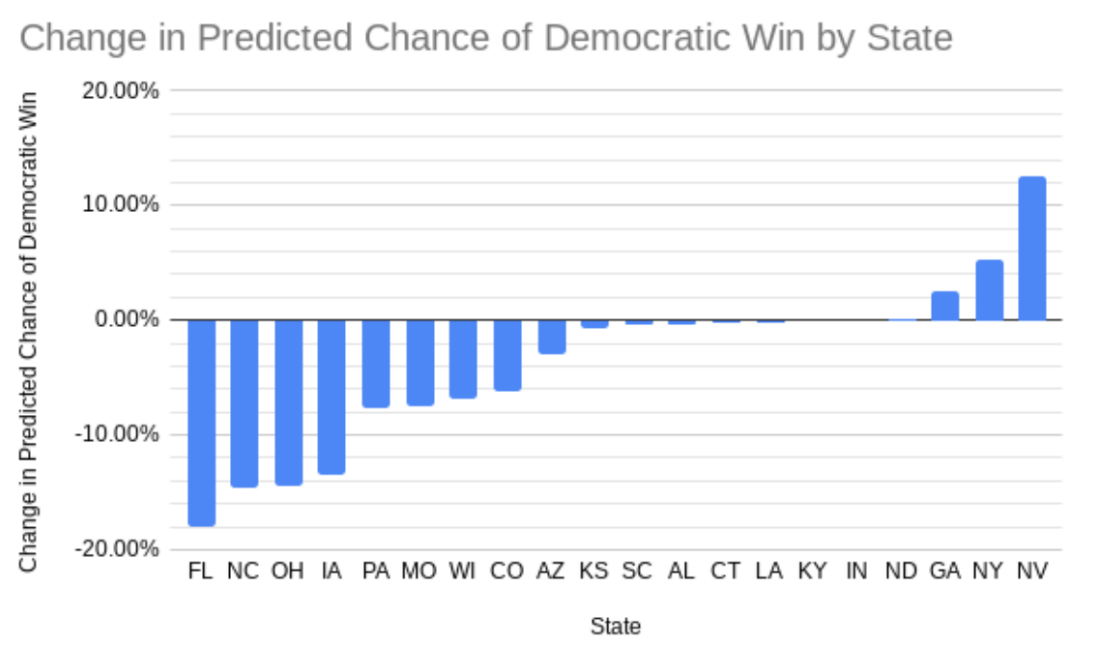
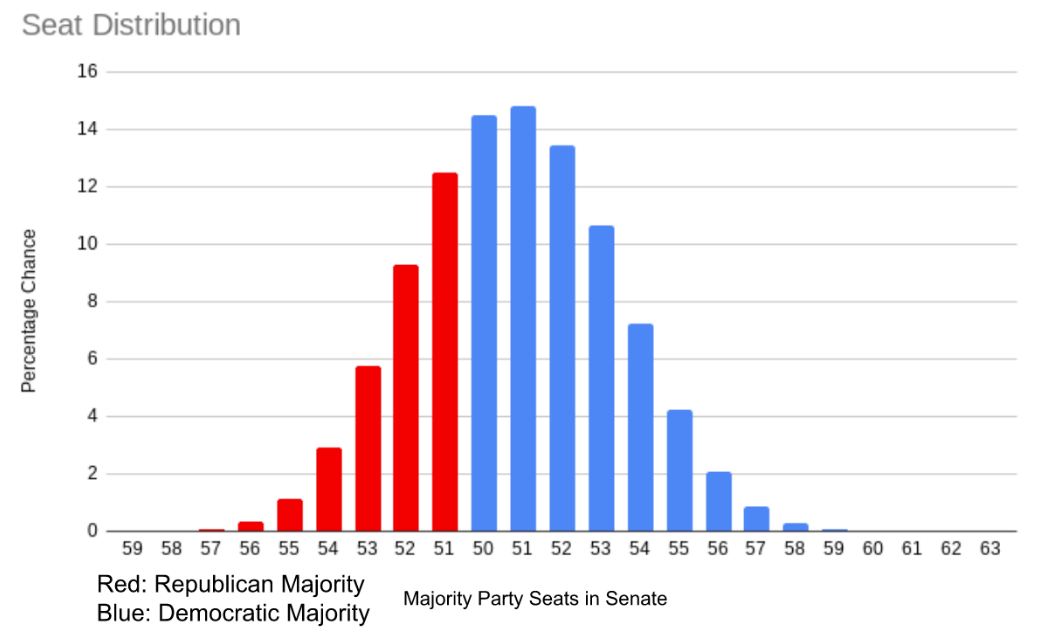
We ran 1,000,000 Monte Carlo simulations of possible election results, and the graph below represents our results using polls up to October 25th, 2022. On that day, our adjusted ORACLE model predicts a 68% chance that the Democrats win the Senate (the distribution is shown on Figure 6), while the unaltered ORACLE model predicts a 78% chance that the Democrats win the Senate. We predict that the most likely outcome is that Democrats win 51 seats in the Senate, while ORACLE predicted 52 seats.
While this single-seat difference may not seem significant, our adjusted model significantly changed the likelihood for each Democratic candidate to win their seat (Figure 5). This is why our adjusted ORACLE model had the Republican’s chance to win 10 percentage points higher, as the Monte Carlo Simulations would have a much higher chance of declaring Republican victory in those states.
Specific Elections of Interest
Arizona
We predict that Mark Kelly (D) is more likely to win than Blake Masters (R), but we put gave the Democratic candidate a 53% chance to win in our adjusted model as opposed to a 56% chance according to the original ORACLE model.
Georgia
We predict that Herschel Walker (R) has a slightly higher chance of winning than Raphael Warnock (D), but we give Warnock better odds than ORACLE. Warnock has a 49% chance of winning according to our model, while according to ORACLE, Warnock has a 47% chance of victory.
Nevada
We predict that Catherine Masto (D) has very solid odds of winning - 57%! - over Adam Laxalt (R), while ORACLE predicted that Laxalt has a 55% chance of winning.
Pennsylvania
We predict that Mehmet Oz (R) has a 54% chance of winning, while ORACLE gives Fetterman a 54% chance of becoming a Senator.
Wisconsin
We predict that Mandela Barnes (D) is going to lose with a fair margin against Ron Johnson (R) with a 38% chance of winning, which makes the race significantly less competitive than how ORACLE predicts it. They put it at a 45% chance of a Democratic win.
Conclusion
We confirmed the claim that polling as a whole has been historically biased in favor of the Democrats, specifically in the Midwest and the South. It should be noted that this is a general trend, and varies by state and race.
However, this consistent trend is not accounted for by the ORACLE model. ORACLE does attempt to account for historical polling error by adding variance with GOOFI, but that misunderstands the nature of the problem. Results are not randomly distributed around the true percentage of support for a candidate, but are instead consistently biased in one direction. Not accounting for this has led to ORACLE overestimating overall support for Democratic candidates for every election in recent years.
Clearly, it is not possible to predict error hyper-acccurately before an election occurs, but it can be ballparked - with more advanced statistical methods than we used, better predictions can certainly be reached. This allows for some measure of correction, but it must be borne in mind that the simplest method of resolving this is for pollsters to determine the source of their consistent polling bias and correct for it.