Introduction
The Internet is one of the most volatile places for information to spread nowadays. Previously, it would take days for scandals and other sudden controversies to spread through gossip columns in newspapers. However, with online news more prevalent now than ever, it takes mere minutes for information to make its way into the voter base of a candidate. These sudden changes in opinion may not be accurately reflected within polls, which can often lag behind current events.
Ubiquitous in nearly all browsers, Google is the de facto proxy for Internet searches. It also collects a lot of data on the patterns its users show. We aim to harness the data that Google provides regarding user searches to accurately account for current events in each race through the Internet’s interest in each candidate.
Specifically, we query Google search trends with the names of both candidates in each race. From this, we take the interest over time in each candidate over the last 30 days, and run a linear regression on that data. Large spikes or other outliers in these search trends result in a smaller coefficient of determination in the regression, signifying a more volatile and unpredictable voter base. To factor this into the ORACLE, we sum 1 minus the coefficient of determination for both candidates in a race, and scale it down by a factor of 30. This is then added to the overall variance calculated by ORACLE.
\( \text{MOIST} = \frac{2 - ((r^2)_\text{dem} + (r^2)_\text{rep})}{30} \)What exactly will our adjustment do? Increasing the variance in the model doesn’t give either candidate an edge over the other. That’s because it’s just a number that reflects uncertainty in the model. In this scenario, our variance comes from Google Search trends. In other words, if a certain race or candidate is being searched more frequently, there is a high likelihood that some major event related to said candidate has occurred and may affect the outcome of the race. In this fashion, more searches for a candidate can be both positive and negative. Our model simply tries to reflect any significant occurrences recently that may not be shown in polling. Thus, most of the predicted proportions should more or less remain the same, with only a select few races demonstrating a change.
Results
Note: These results and case studies were collected from models run on October 27, 2022.
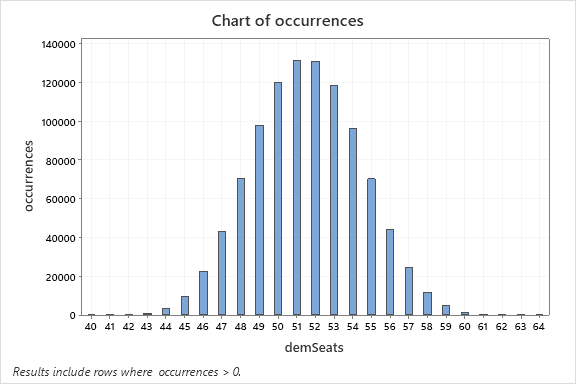 Histogram of seats won by the Democratic party when search trends are included in the variance.
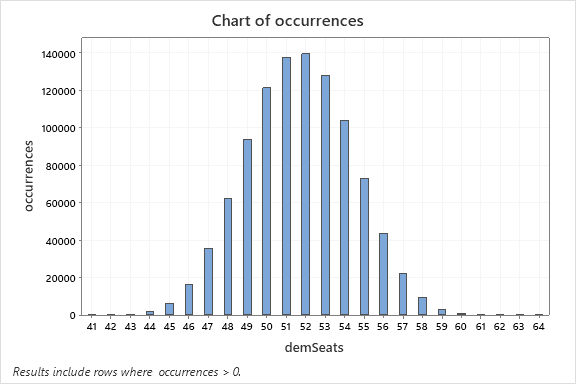 Histogram of seats won by the Democratic party when search trends are NOT included in the variance.
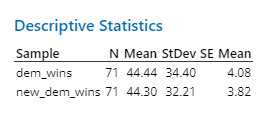
A brief glance at the histograms will reveal that they are both approximately normal and centered between 51 and 52 seats, which makes sense considering the sample size.
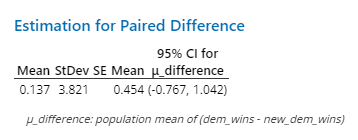
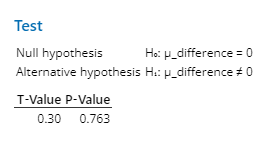
To compare the results, we ran a matched pairs t-test comparing our model to the original one, which compares each individual race before and after applying our technique. A brief glance at the descriptive statistics will reveal that the standard deviation of the projected democratic wins went down after including a new source of variance. This is because our model increases variance on a race-to-race basis. The increased variance allows a disadvantaged candidate a higher likelihood to win the election. In other words, the probability for each party to win the seat will shift closer to 50-50. As a result, the standard deviation of our model will decrease.
We found that if we assume there is no difference, then there is a 76.3% chance that we get these results. Thus, we cannot conclude that overall, our method had a significant effect on the predicted race outcomes. But this is what we want! Search trend data shouldn’t have a huge effect on the overall results -- instead, it should only make a sizable difference in races with candidates who have received considerable media attention, such as Ron DeSantis or Herschel Walker.
Case Study 1: Florida Governor
Ron Desantis (R) recently made the news due to his messy relations with Donald Trump which led to his exclusion from a Trump rally. He has also shown up as a texting buddy with Tom Brady. The majority of his news attention is negative. Accordingly, when we factor in his Google search trends, this spike in interest should result in more variance as more voters overall will search him up, pushing his win probability closer to 50%.
Spikes can be seen in search trends for Ron Desantis: some on the left (Hurricane Ian response), one towards the right (texting Tom Brady), and one starting to form all the way on the right (excluded from Trump rally)
This added search trend variance shifts the race’s variance in ORACLE from 18 to 24. Without our technique, Ron Desantis is predicted to win in 79% of all outcomes. When we factor in his search trends, this number decreases to 71% percent.
Case Study 2: Georgia Senate
Herschel Walker (R) was recently under fire for allegations stating that he pressured women into having abortions, even though he is strongly anti-abortion. This has raised an outcry of hypocrisy against him from pro-choice supporters, and subsequently he has attracted a lot of news attention. Similar to Ron Desantis’ case, we should be able to see a shift in his percentage of winning towards the 50% line.
The two news stories related to Walker’s abortion controversy can be seen in the search trends: the left spike being his initial denial of the incident, and the other being him admitting that payments were made, although still denying knowledge of an abortion.
In this race, our added variance brought Walker’s predicted win rates from 46% to 48%. It’s a small change but in a close race such as this, it becomes significant.
Limitations
Our method was generally successful in adding variance to races with volatile search trends. However, if there had been more time, further improvements could have been made. For one, observing trends over the past month may be too long of a period. Significant deviations in search trends that far back are likely to already be reflected in polls by the time we run the model, so the added variance would be unnecessary and detract from the integrity of the results. A solution to this would be isolating the search trends since the latest poll for each state. This way, we can account for noticeable sways in public opinion without affecting the rest of the data.