We have a huge issue at hand: the polls. Our model takes polls at face value; due to time constraints, we had to assume polls were not inherently biased, but they are — polls generally tend to overpredict the Democrats. This could be one of the reasons our model is giving them a significantly higher chance of winning the senate majority.
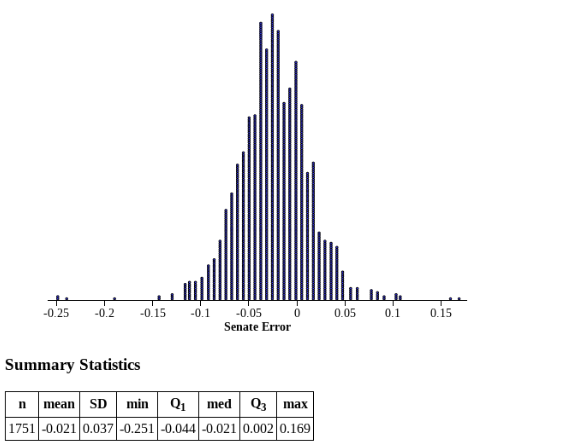
Here’s the graph of the average poll error across the 2018 and 2020 senate cycles:

A bias of over two points! Granted, we did not weight these polls based on when they were conducted, so a weighted average of the bias would most likely be significantly lower (as inaccuracy would most likely decrease for polls closer to the election). Regardless, we decided this was an issue we wanted to tackle. FiveThirtyEight’s oldest senate dataset is from 2018, so we could only use data from the last two election cycles in our calculations. We used polls only from “seesaw states” in 2022, which we specified as having less than 40% difference in win probability between the two parties (at most 70% predicted win percentage for either party and 30% for the other). Viewing our model’s values as flawed, we determined the swing states from FiveThirtyEight’s projected win probabilities on 10/21/22. The states were: Nevada, Georgia, Wisconsin, Arizona, Pennsylvania, New Hampshire, Ohio, and North Carolina. While most of these have only had one senate election since 2018, both Arizona and Georgia have had two. Thus, we were working with 10 races from eight states. We calculated a weighted average of the polls for each of these races using the exact same methodology our model does. These were the results, where a negative error value is a Democratic lean, and a positive value is a Republican lean:
| States | Poll Estimation | Real Value | Error |
|---|---|---|---|
| Nevada | 0.5031567979 | 0.5260960334 | 0.02293923551 |
| Georgia (Osoff v Perdue) | 0.4791666667 | 0.506 | 0.02683333333 |
| Georgia (Warnock v Loeffler) | 0.5001141986 | 0.51 | 0.009885801436 |
| Pennsylvania | 0.5815725568 | 0.566632757 | -0.0149397998 |
| Wisconsin | 0.5616381816 | 0.5545545546 | -0.007083627003 |
| North Carolina | 0.5209400416 | 0.4905857741 | -0.03035426757 |
| Ohio | 0.5680419299 | 0.534 | -0.03404192995 |
| Arizona 2018 | 0.5010168509 | 0.512295082 | 0.01127823107 |
| Arizona 2020 | 0.5349380717 | 0.495 | -0.03993807168 |
| New Hampshire | 0.5812905298 | 0.5799180328 | -0.001372497013 |
We decided to create a weighted average of these errors for a shift that would be applied to our polls calculations. Our methodology was as follows:
- If there was only one senate race in a given state over the past two election cycles, that race would be weighted 0.2, while the remaining 0.8 would be distributed among the other nine races
- If there were two senate races in a given state (Arizona and Georgia) over the past two election cycles, each race would be weighted 0.16 while the remaining 0.68 would be distributed among the other eight races
| State | Shift |
|---|---|
| Nevada | -0.002499515314 |
| Georgia | -0.002073520184 |
| Pennsylvania | -0.006708297016 |
| Wisconsin | -0.005835388927 |
| North Carolina | -0.008421015656 |
| Ohio | -0.008830755921 |
| Arizona | -0.006976943337 |
| New Hampshire | -0.005200818928 |
Thus, the Democratic two-party percentage shifted down from between 0.2 to 0.8% in each of the eight states above after adding our calculated shift values (Fig. 3). We also added variance to these shifts by calculating the standard deviation of the errors from the previous cycles. However, after adding variance to our win percentage values adjusted by shifts, we found this variance had a negligible effect on the results of the simulation, so we decided to remove. These shifts added to the polling averages for each state in combination with the simulation outputs:
| State | Original Win% | Adjusted Win% | Change (%) |
|---|---|---|---|
| Nevada | 47.7097 | 46.3444 | -1.3653 |
| Georgia | 48.3858 | 47.2704 | -1.1154 |
| Pennsylvania | 54.5664 | 51.5588 | -3.0076 |
| Wisconsin | 44.6649 | 41.3116 | -3.3533 |
| North Carolina | 43.671 | 39.8332 | -3.8378 |
| Ohio | 42.1017 | 37.9903 | -4.1114 |
| Arizona | 56.0142 | 52.7628 | -3.2514 |
| New Hampshire | 59.7022 | 57.1412 | -2.561 |
By accounting for the various biases, we found significant changes in every “seesaw’ state we analyzed. Every race’s two-party percentage was adjusted by at least 1%, with five out of the eight “See-saw” states shifting more than 3% in favor of Republicans. Through our model — altered for “non-seesaw” states — we want to observe whether the general trend related to the polls continued to see shifts in favor of Republicans. This would significantly change projections to represent more holistic values. Hopefully, taking historical polling errors into account will make its way into the next Oracle’s methodology.