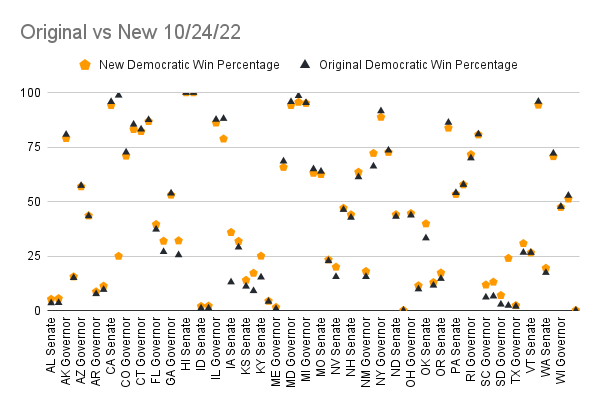
FiveThirtyEight’s Polling grade is calculated by analyzing the historical accuracy of each polling company, the type of election polled, the poll’s sample size, the performance of other polls surveying the same race, and several other non-published factors. If multiple polls for the same race are published by the same company, FiveThirtyEight takes the average of the grades and puts that as all of the polls’ grades.
Blair’s ORACLE thought it would best to only include poll’s with the grades of C or above. The D, E ,and F grade polls were considered low quality and inaccurate, and so were not included in the original calculations. Our goal is to include those polls and see how it would affect the final result. From this we can see if we should have included them or removed them in our final decision .
In order to calculate the difference it will make we will include those polls into our final calculations most likely altering the results, then afterwards take the final results from blair ORACLE to compare to our calculations.
We are predicting that the inclusion of these lower grade polls will skew the results unproportionally to either side.
We choose to compare the polls as of October 24, 2022.

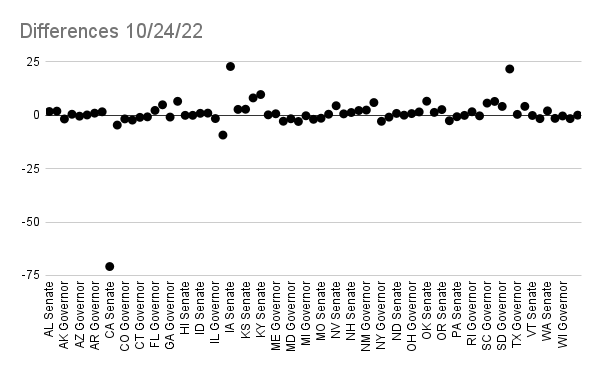
 In the differences graph above, if the point is positive it means that the low grade polls boosted the Democratic win percentage, and if it is negative, it means that the Democratic win percentage decreased.
The average of the difference in win percentage is 0.426584507. However even though the average is really low there are some noticeable differences in races like the California senate in which it had -70 difference. This probably stems from the fact that there may have not been many polls in places with massive differences, but also means if they were taken in the final calculations that the results would’ve been skewed by a lot in our model.
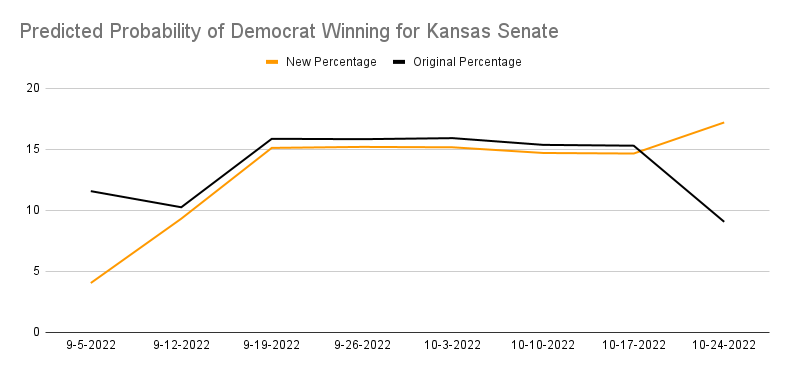
We also decided to analyze how including these polls in our calculations would affect one particular race over time.

Comparing the two win probabilities for the Kansas Senate race, we can see that the difference between them is inconsistent. During the 9-5-2022 polls, the original percentage, that is the one not including the lower grade polls, is significantly higher than the new percentage, the one including the lower grade polls. Taking a look at the polls as of 10-24-2022, the new win percentage is higher than the original. If the two win probabilities were consistent, then one line would be continuously above the other and they would not intersect. However, this is not the case. The differences between the two lines greatly varies, and the lines intersect, which is not consistent or predictable.
We compared multiple races, and multiple dates of the same race, and the polls didn’t lean any one way so there is no clear pattern or correlation. They indeed did cause some changes in win percentages, but the inconsistency of the lower grade polls proved that they are unreliable. In our opinion, Blair’s ORACLE was right to exclude these polls.