Introduction
When creating a model for election predictions, there are many different factors to consider and many paths that can be taken to achieve the most accurate result. It is important to compare models with each other to see how different methodologies produce different predictions. Specifically, we chose to compare ORACLE’s chances of winning predictions of competitive races to the predictions of the 538 Deluxe Senate and Governor models.
Methodology
Overview
The fundamentals of 538’s model and our model are very similar. The basis for both ORACLE and 538’s models are, put very generally, based on a few main factors: priors and polls. However, the execution and details of each are very different.
The main features of ORACLE’s model are: BPI (used to adjust based on results of past elections), BABOON (used to calculate lean), VIBE (add variance to our model based on the number of uncommitted voters), and correlation between similar races.
Meanwhile, the main features of 538’s model are their “Fundamentals of Model” (background of candidates), Polls (collecting/weighting/adjusting), CANTOR (estimate lightly polled districts by comparing to similar districts), and error (identifying sources of error and adjusting).
Comparison of Priors / Fundamentals
ORACLE and 538 both calculated the partisanship lean of a state to incorporate into their models (BPI for ORACLE).
538 took into account numerous additional factors, including fundraising, incumbency, candidate experience, scandals, an incumbent’s approval rating, and the partisanship lean of a State. For Senate races, they also take into account a candidate’s Roll call voting record, which accounts for how often they vote with their party--incumbents who are more “Maverick-y” outperform those who don’t break party ranks.
Differences in collecting, weighting, and adjusting polls Both models use polls compiled by 538 on its website. Additionally, both filter out certain polls, but they use different criteria. ORACLE takes out all polls that have a 538 pollster grade worse than a C+. 538 takes out taking out all polls that they have significant concerns about their veracity, DIY polls by nonprofessional hobbyists on online platforms (eg Google Forms), and “polls” that blend or smooth their data.
The main differences between the polling averages of the two models come from their poll weighting schemes. While both models take into account the recency of the poll, 538 also weighs by sample size and pollster rating. Their algorithm also will insist on constructing an average of polls from at least two or three distinct polling firms even if some of the polls are less recent. Another important difference is that 538 does likely voter adjustment (they take the results of polls of registered voters or all adults and attempt to translate them to a likely-voter basis) and timeline adjustment (they adjust for the timing of the poll based on changes in the generic congressional ballot). One note here is that 538 does not detail the weights it gives the priors and polls when combining the two.
Correlation
ORACLE has a correlation scheme, where the predictions for races with similar demographics were correlated. The purpose of this step was to adjust the “naive” predictions because if predictions were wrong for one race, they would likely be similarly wrong for races with similar demographics.
On the other hand, 538 has CANTOR, which infers what polling would say in unpolled or lightly polled states and districts, given what it says in states and districts with similar demographic, geographic, and political factors.
Comparison of Chance of Winning (%) Predictions between ORACLE and 538
We compared the final ORACLE and 538 predictions of election results in battleground states using t-tests. These states for the Senate were: Georgia, Ohio, North Carolina, Nevada, and Wisconsin; These states for the Gubernatorial election were: Arizona, Kansas, Nevada, Wisconsin, and Oregon. Our dataset for each t-test took the final chance of winning from ORACLE and 538 on 10/27/22 and took their difference, giving us a dataset of 5 values. Our null hypothesis was that there was no difference between the predictions of ORACLE and 538. We found that for the Gubernatorial Race race, the p-value was 0.828, showing that we do not have evidence to show that the final ORACLE and 538 predictions were different. For the Senate, the p-value was 0.033, indicating that we have sufficient evidence to suggest that ORACLE and 538 are different.

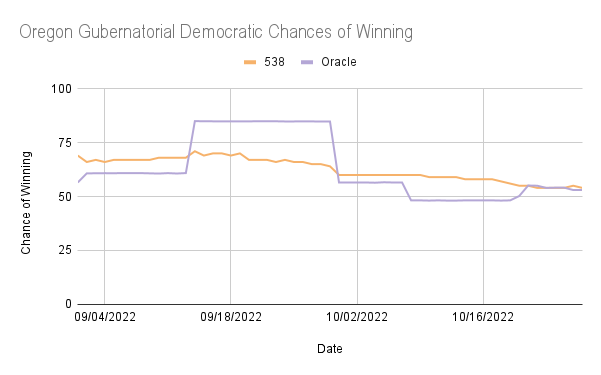
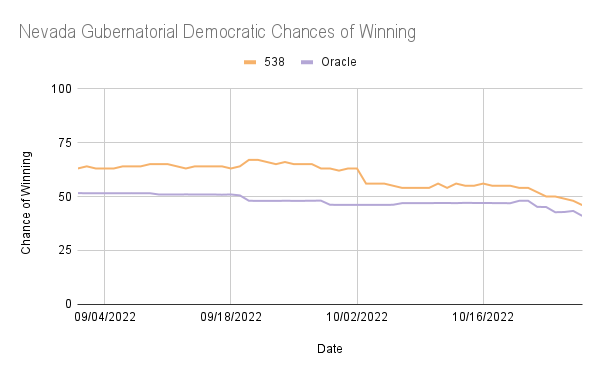
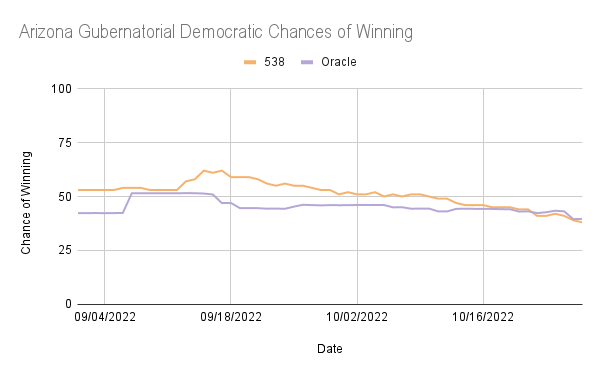
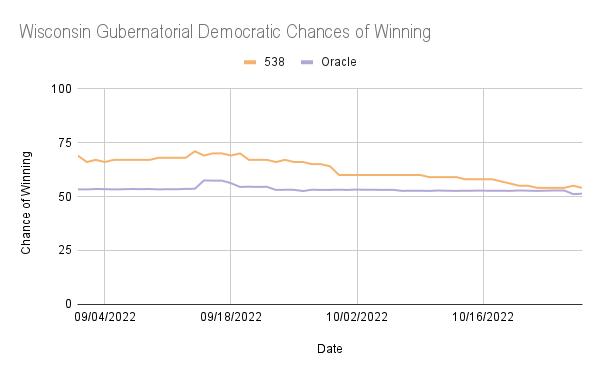
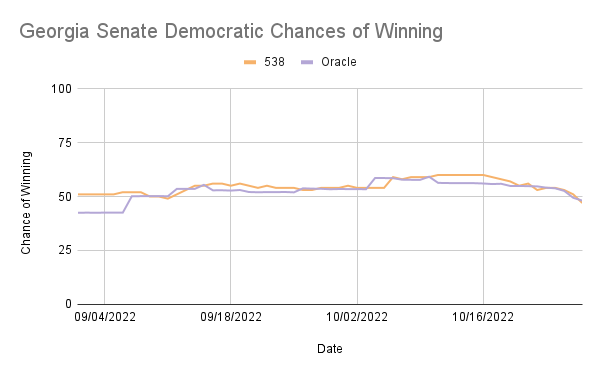
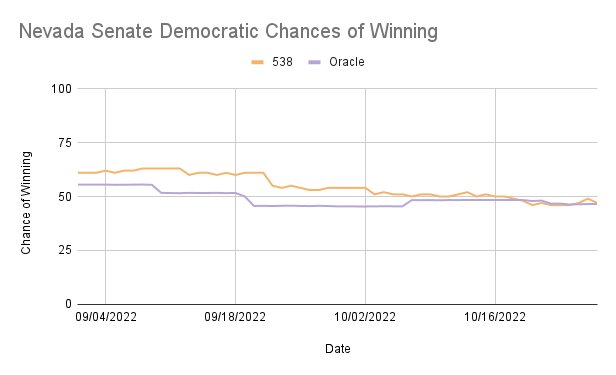
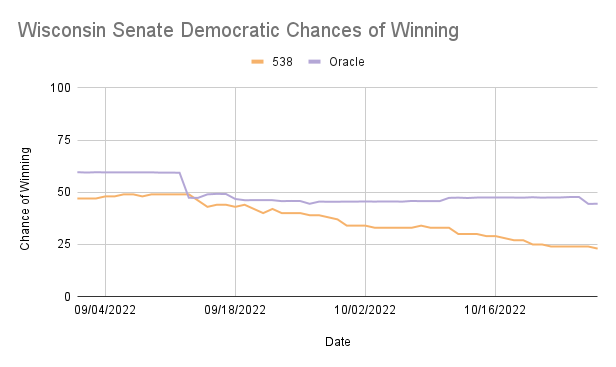
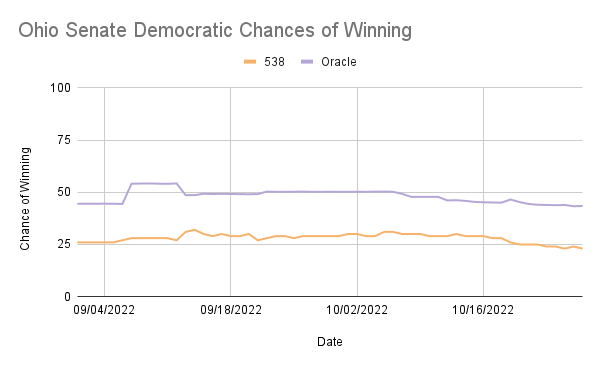
The graphs below compare the ORACLE and 538 predictions for Democratic win probability. Observing graphs comparing the Democratic chance of winning predictions on each day, we can see that six out of ten of ORACLE’s predictions become closer to 538’s election day approaches, suggesting that our model either relies heavily on the number of polls taken or factors in time from the current day too much.
Gubernatorial Elections
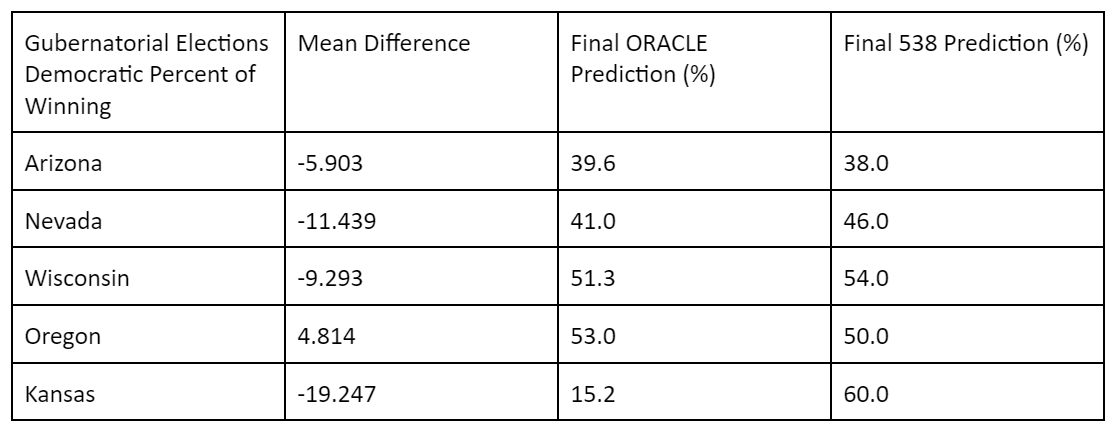
Looking at Gubernatorial races for all states, with the exception of Oregon, ORACLE tended to underestimate Democratic chances of winning compared to 538. This can be attributed to 538’s much more extensive focus on priors/fundamentals. While ORACLE only took into account the incumbency of a candidate, 538’s priors are much more detailed, individually looking much more in-depth into different aspects of individual candidates. In many aspects, 538 simply took into account more factors, so it is difficult to say which one specifically led to the difference observed. However, the use of fundamentals seems to be an area where 538 and ORACLE differ the greatest in execution.
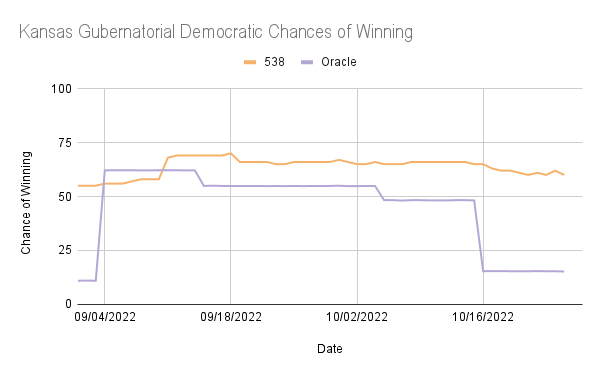 It is interesting to note that in the ORACLE Gubernatorial predictions for Oregon and Kansas, there were long periods of stagnation in the predictions with high fluctuation before and after the periods of stagnation. In Kansas, the ORACLE prediction was around 11% from 9/1/22 to 9/5/22 while 538 was 55%, and ORACLE was around 15% from 10/18/22 to 10/27/22 while 538 was between 60% and 65%. In Oregon, ORACLE predicted the Democratic chances of winning to be nearly 85% from 9/14/22 to 9/29/22, while 538 predicted it to be between 58% and 68%. This suggests that the ORACLE model was strongly affected by a single poll and did not shift back to a more expected output until a new poll was uploaded.
Other Graphs
Senate Elections
 In North Carolina, Ohio, and Wisconsin, ORACLE consistently overestimates the Democratic chances of winning compared to 538, while in Georgia and Nevada, ORACLE underestimated at times but was frequently very similar to 538’s predictions. These are reflected in the mean differences, with Georgia and Nevada being negative and each having less than a 6% difference in the percentage of winning, while North Carolina, Ohio, and Wisconsin all had positive differences in the percentage of winning greater than 10%.
Relavant Graphs

Conclusion
Although there were some differences between the predictions of ORACLE and 538 due to differences in methodology, specifically in the priors. Final predictions for the Senate showed that there was evidence of a difference between 538 and ORACLE predictions, as seen in the p-value, while the Gubernatorial race predictions showed no evidence of differences according to the p-value. Looking at the graphs of predictions over time, the Senate showed more consistency in ORACLE predictions, while the Gubernatorial predictions fluctuated for Kansas and Oregon.
Overall, it was a good effort and learning experience for us all. We hope that with this knowledge, we will be able to perform even better in future years.