Introduction
In the Blair Oracle model this year, BPI (Blair Partisan Index) is a weighted average of previous election results in a state to add accurate historical bias into the calculation of the state’s predictive center in the model. The current weights for BPI go all the way back to 2014, albeit weighting them lower than more recent polls. We decided that election results after 2016 are significantly more reflective of the current political landscape and therefore should be weighted accordingly to account for this recent shift. In 2016, Donald Trump was elected into office, reshaping American politics. Throughout his time in office, the outspoken former President utilized media and policy to gain conservative victories, making America increasingly polarized. We hypothesize that by shifting the BPI to only weigh elections within the past 6 years will generally cause the BPI to lean more Democratic, better reflecting today’s political climate.
Methodology
In the original model, 2020’s elections comprise around 45% of the total weight. 2018’s make up about 25%, 2016 is a bit over 20%, and 2014 fills in the last 10%. Our BPI model concentrates more of the weight in recent elections; 2020 has 62% of the weight, 2018 covers 28%, and 2016 makes up the final 20%.
| Election | Original BPI Weight | BIPBLEEP Weight |
|---|---|---|
| 2014 Senate | 0.05 | 0.0 |
| 2014 Governor | 0.04 | 0.0 |
| 2016 Presidential | 0.042 | 0.033 |
| 2016 House | 0.035 | 0.019 |
| 2016 Senate | 0.075 | 0.024 |
| 2016 Governor | 0.06 | 0.024 |
| 2018 House | 0.0435 | 0.06 |
| 2018 Senate | 0.10 | 0.11 |
| 2018 Governor | 0.10 | 0.11 |
| 2020 Presidential | 0.15 | 0.20 |
| 2020 House | 0.0945 | 0.12 |
| 2020 Senate | 0.11 | 0.15 |
| 2020 Governor | 0.10 | 0.15 |
When calculating the new BPI, we found an average shift of 0.506403501 percent towards the democratic lean. When doing a matched-pair t-test on the BPIs from the original model and the ones calculated with BIPBLEEP with a significance level of 0.05, we found a p-value of 0.001094, showing a significant difference in the BPIs when using BIPBLEEP’s weights as opposed to the base ORACLE model.
Results
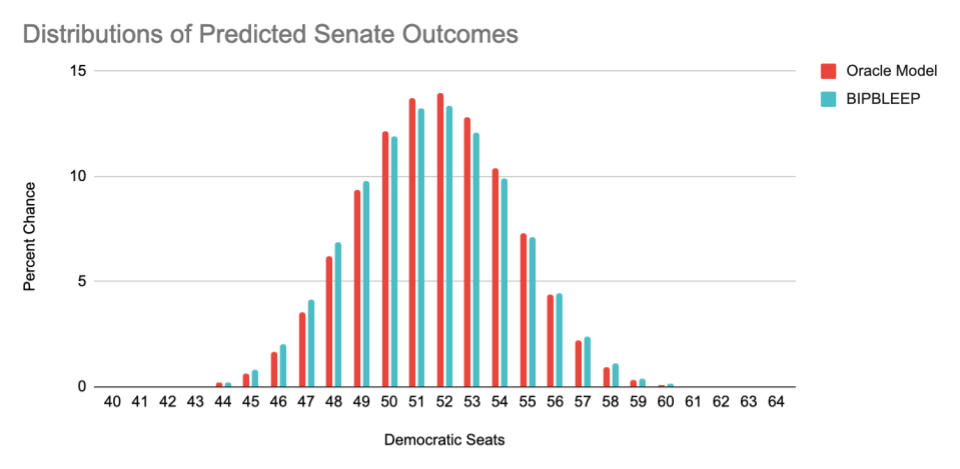
When implementing the BIPBLEEP BPI into the model, however, the results were much less pronounced. The predicted win percentages for each race shifted ever so slightly democratic (mean = 0.1883), but not enough to be significant with a matched-pair t-test (p = 0.5953). The low effect on election predictions translated into little change in the model’s overall predictions for the senate, with a slight shift democratic and spreading out of the probability curve for seat amounts, but nothing very significant.
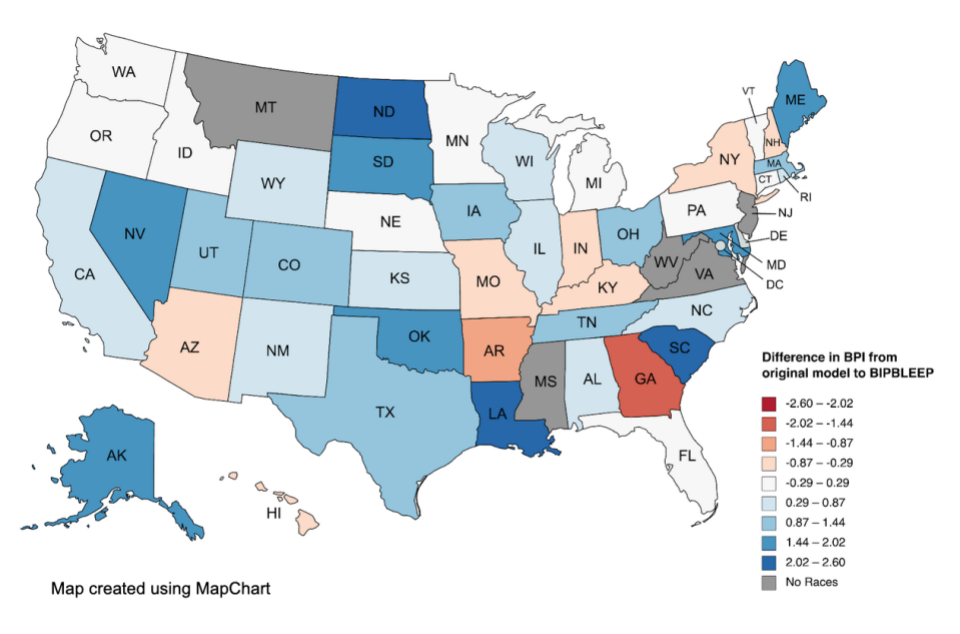
Even in states where the BPI was more affected by BIPBLEEP, such as Georgia, the effect on the predicted outcome of each race was minimal, with only a 1.0898% and 1.8234% shift republican for the Senate and Governor’s race respectively. The races where BIPBLEEP had a much more profound effect were on races with few to no polls, where BPI had a greater overall effect on the model’s outcome. Alaska is one such example, and although the Senate race is between two republicans, the prediction for the Governor’s race shifted over 6% to the democrats, although the model still only has a 21% chance of a democratic victory. A similar story happens in South Carolina, where an over 7% shift in the prediction towards the democrats in both races brings the Democratic candidates to just over a predicted 13% chance of winning. Less close races often have fewer polls, so BPI, and therefore the changes induced by BIPBLEEP would have a greater effect.
Analysis
One explanation for why the different BPI didn’t lead to differing election predictions is that BPI often isn’t a huge factor in the model as a whole. BPI is a “prior”, meaning it is the state’s predicted partisan lean before polls are factored into the model. Polls give a much more recent and current look into how a population will vote. To balance the prior information and polls, an equation based on the number of polls (n) and number of polls in the last 30 days (n30) was used to calculate the percentage of the model’s lean to be determined by polls and not BPI/BABOON (BPI combined with national mood for Senate races)
Arctan returns 0 if there are no polls and PI/2 with an infinite amount of polls, so w will be within a range of 0 to 0.85. Most close races have quite a few polls taken into account, so often BPI’s effect is low. For Senate races where BABOON is used instead of just BPI, BPI’s effect is slightly more diluted by the BABOON equation where X is the national mood.
On average, the BPI for each state shifted more towards the democratic side when the most recent elections were more heavily weighted, and thus our original hypothesis was supported. However, the shift in BPI did not have a large impact on the actual election predictions because the model as a whole takes polls into greater consideration than previous election results.